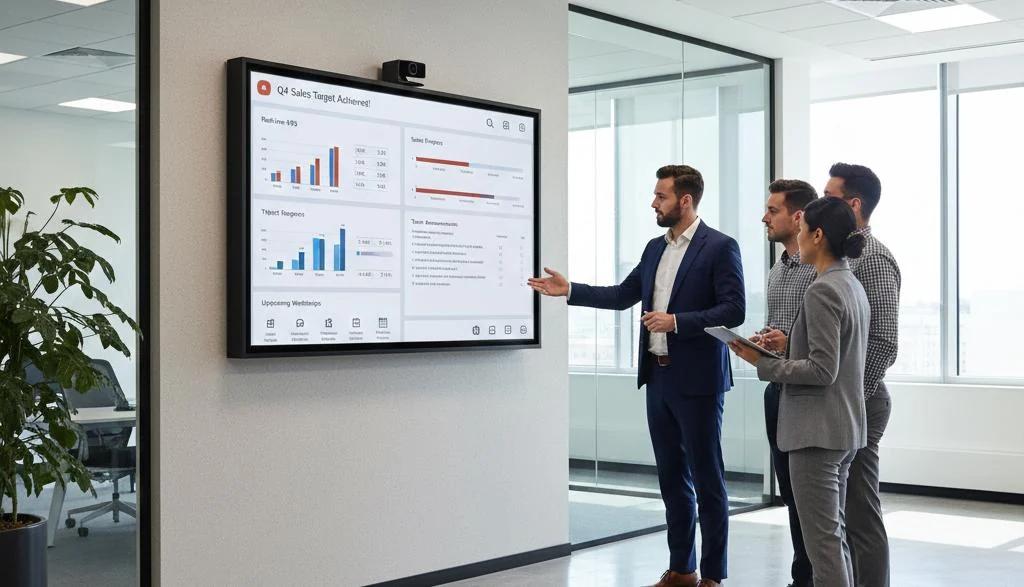
You have screens in your stores, offices, restaurants, campuses, or other business locations. They are displaying promotions, product information, announcements, menus, wayfinding content, or brand messaging.
But there is one question that eventually comes up in every digital signage project:
Is it truly working?
That is where digital signage ROI comes in.
Measuring the return on investment of digital signage is not as simple as counting how many times a piece of content played. A screen can have thousands of impressions and still have very little business impact. What matters is whether your digital signage changes something that matters to the business, such as sales, conversions, average order value, customer engagement, operational efficiency, or communication costs.
The good news is that you do not need a complicated analytics setup to start measuring digital signage performance. You need to define what success looks like, establish a baseline, choose the right digital signage KPIs, and connect screen activity to business outcomes.
Here is how to do it.
What is digital signage ROI?
Digital signage ROI measures the financial return generated by a digital signage investment compared with the total cost of running it.
The basic digital signage ROI formula is:
The important part is deciding what counts as a benefit and what counts as a cost.
Your total investment can include:
- Digital displays and media players
- Digital signage software
- Installation and maintenance
- Content creation
- Staff time spent managing content
- Electricity and connectivity
- Hardware replacement and repairs
Your returns can include:
- Increased sales
- Higher conversion rates
- Increased average order value
- More sales of promoted products
- Reduced printing and distribution costs
- Lower content update costs
- Reduced staff time spent answering repetitive questions
- Increased customer engagement
- Improved internal communication
- Shorter perceived waiting times
- More interactions with QR codes, promotions, or other calls to action
This is why digital signage ROI is broader than sales alone. Depending on the use case, your screens might be generating revenue, reducing costs, improving customer experience, or doing several of these things at once.
Why measuring digital signage ROI matters
Digital signage can be easy to justify when everyone can see the screens working. Proving that the screens are contributing to business performance is a different challenge.
A screen displaying a promotion does not automatically mean that promotion generated a sale. Likewise, a screen that receives 10,000 impressions has not necessarily created 10,000 meaningful interactions.
That distinction matters.
In a recent peer-reviewed study covering 237 digital advertising campaigns and 30 million shoppers, researchers found that digital signage increased the likelihood of purchasing featured products by 8.1%. The impact also varied depending on factors such as product type, brand popularity, timing, store traffic, message style, and the distance between the screen and the advertised product.
The takeaway is not that every digital signage network will produce an 8.1% sales increase.
The takeaway is that context matters. Your content, placement, audience, timing, and offer can all influence the result.
That is exactly why measuring your own digital signage performance is more useful than relying on a generic industry benchmark.
What are the most important digital signage KPIs?
The right digital signage KPIs depend on what you want your screens to accomplish.
A retail store trying to sell more products should not measure success in exactly the same way as a corporate office using screens for internal communication.
A useful way to think about digital signage metrics is to divide them into four categories:
- Attention and engagement
- Behavior and conversion
- Revenue and financial impact
- Operational efficiency
Let's look at each one.
1Measure digital signage engagement
Before a screen can influence someone, someone has to notice it.
That makes engagement metrics a useful starting point.
Impressions
Impressions estimate how many people had an opportunity to see your content.
Depending on your digital signage setup, impressions can be estimated using:
- Foot traffic data
- Audience measurement sensors
- Camera-based analytics
- Wi-Fi or Bluetooth data
- POS and location data
- Screen-specific audience measurement tools
Impressions are useful for understanding reach, but they should not be treated as proof of ROI.
Someone walking past a screen is not necessarily someone who noticed, remembered, or acted on the message.
Dwell time
Dwell time measures how long people remain within the viewing area of a screen.
Higher dwell time can indicate that content is attracting attention, particularly in environments where customers naturally spend time, such as waiting areas, restaurants, showrooms, and retail spaces.
However, longer dwell time is not automatically better. A screen displaying confusing information could also make people stop because they are trying to understand it.
The business outcome still matters.
Interaction rate
If your digital signage includes interactive content, QR codes, touchscreens, or other calls to action, track how many people interact with them.
For example:
This gives you a better picture of whether people are doing something with the content rather than simply being exposed to it.
2Measure behavior and conversions
This is where digital signage analytics become much more useful.
Instead of asking:
“Did people see the screen?”
you can start asking:
“Did the screen change what people did?”
Conversion rate
For promotional digital signage, conversion rate can show how many people exposed to an offer eventually completed the desired action.
For example, imagine a restaurant displays a QR code offering a discount on a new meal.
You could track:
- Estimated audience
- QR code scans
- Offer redemptions
- Purchases
- Revenue generated
You now have a measurable path from screen exposure to business outcome.
QR code scans
QR codes are one of the simplest ways to make digital signage measurable.
You can create unique QR codes for:
- Individual screens
- Locations
- Campaigns
- Offers
- Products
- Time periods
That lets you identify which screens or campaigns are generating the most activity.
Promotion redemption
If your signage promotes a discount, coupon, product, or special offer, redemption is often more valuable than impressions.
For example, instead of saying:
“Our promotion was displayed 100,000 times.”
you can say:
“The promotion generated 2,400 QR scans and 640 redemptions, resulting in $X in attributable revenue.”
That is a much stronger business case.
3Measure sales impact
For retail and hospitality businesses, sales lift is often one of the most important digital signage metrics.
Sales lift
Sales lift measures the difference in sales associated with a campaign compared with an appropriate baseline.
A simple calculation is:
The difficult part is establishing a reliable baseline.
If sales increased after you installed digital signage, you cannot automatically assume the screens caused the increase. Other factors could have changed at the same time, including pricing, promotions, seasonality, weather, foot traffic, advertising, or product availability.
That is why controlled comparisons are more useful.
A/B testing digital signage
One of the strongest ways to measure digital signage effectiveness is to compare similar environments.
For example:
- Store A uses the promotional screen.
- Store B does not.
- Both stores have similar customer profiles and sales patterns.
You can then compare the relevant sales data.
You can also test different content on similar screens.
For example:
Then compare:
- Sales
- QR scans
- Conversion rate
- Average transaction value
- Product-level performance
This turns digital signage from a branding channel into something you can test and optimize.
4Track average transaction value
Digital signage does not always need to bring in completely new customers to generate ROI.
It can also encourage existing customers to spend more.
For example, a restaurant might use digital displays to promote:
- Meal upgrades
- Desserts
- Drinks
- Combos
- Premium products
If average transaction value increases after introducing targeted upsell content, that can become part of the ROI calculation.
Compare the metric before and after a campaign, while accounting for other variables that could affect spending.
5Measure cost savings
This is one of the most overlooked areas of digital signage ROI.
Your screens can create value even when they do not directly generate additional sales.
Think about how much your business currently spends on printed communication.
You might be paying for:
- Posters
- Flyers
- Menu boards
- Price tags
- Promotional signage
- Installation
- Distribution
- Reprinting
- Staff time spent replacing outdated material
With digital signage, one centrally managed update can replace dozens or hundreds of manual changes.
That means you should calculate the operational savings alongside your revenue impact.
For example:
If a retailer previously needed to print and distribute promotional materials every time an offer changed, those costs become part of the business case for switching to digital signage.
6Measure staff time saved
There is another operational benefit that is easy to overlook.
Digital signage can reduce the amount of time employees spend communicating information manually.
Consider a hotel, hospital, university, office, or large venue.
If visitors regularly ask:
- Where is the conference room?
- When does the event start?
- Where is the registration desk?
- Which floor is the meeting on?
- What is today's schedule?
digital signage can answer many of those questions before an employee has to.
You can measure this by comparing the number of repetitive enquiries before and after implementing digital signage.
Even a small reduction in staff time can become meaningful across multiple locations.
7Measure customer experience
Not every digital signage objective translates directly into revenue.
For example, screens used in waiting areas might be designed to provide information, entertainment, or updates rather than sell a product.
In those cases, useful digital signage KPIs can include:
- Customer satisfaction
- Survey scores
- Net Promoter Score
- Perceived waiting time
- Complaints
- Information requests
- Wayfinding success
- Engagement with informational content
A screen that helps a customer find the right department may not generate a measurable sale, but it can still deliver a meaningful return.
This is where return on objectives, or ROO, can complement traditional ROI.
ROI vs. ROO: Which should you measure?
ROI works well when the outcome can be expressed financially. ROO is useful when the primary objective is something else.
For example:
| Digital signage goal | Useful metric |
|---|---|
| Increase product sales | Sales lift |
| Increase upsells | Average transaction value |
| Generate leads | QR scans or form submissions |
| Promote an offer | Redemption rate |
| Reduce printing | Annual printing savings |
| Improve wayfinding | Directional enquiries |
| Improve internal communication | Message recall or employee survey results |
| Reduce perceived waiting time | Customer satisfaction or perceived wait time |
| Improve engagement | Dwell time or interaction rate |
The important thing is to define the objective before measuring performance.
Otherwise, you can end up collecting a huge amount of data without knowing what any of it means.
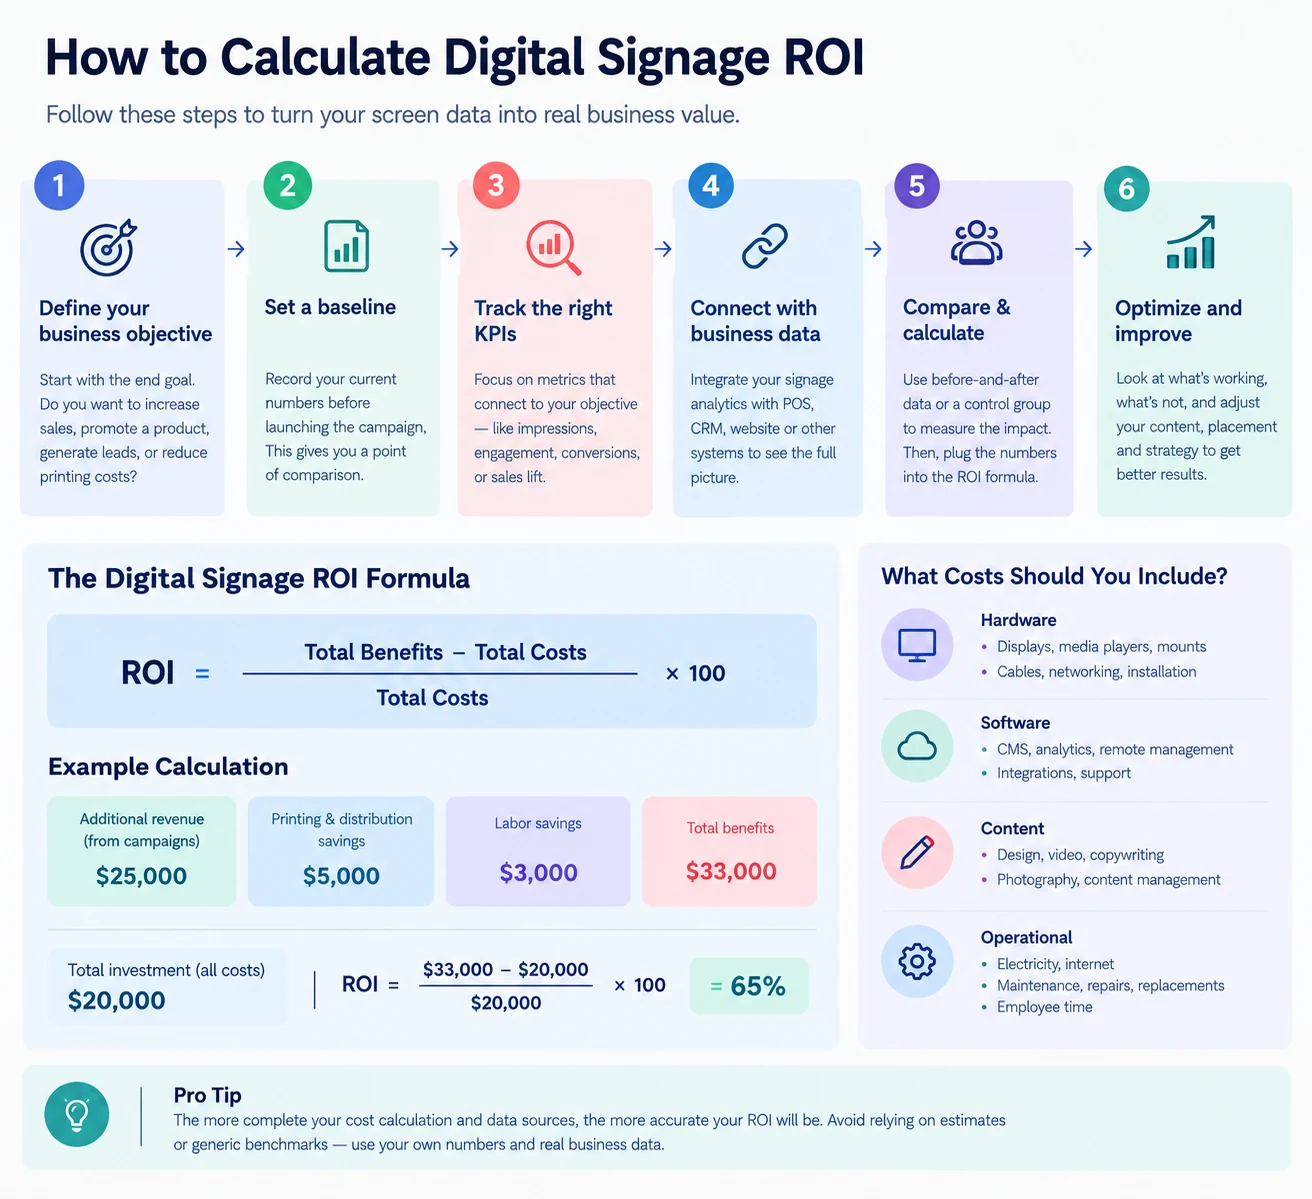
How to calculate digital signage ROI step by step
Here is a simple digital signage ROI framework you can use.
Step 1: Define the business objective
Start with the business problem, not the screen.
Do you want to:
- Increase sales?
- Promote specific products?
- Improve upselling?
- Generate leads?
- Reduce printing costs?
- Improve customer communication?
- Reduce staff workload?
- Improve the customer experience?
Your objective determines the metrics you need.
Step 2: Establish a baseline
Record the relevant numbers before launching the campaign.
For a retail promotion, that could include:
- Product sales
- Store traffic
- Conversion rate
- Average transaction value
- Promotional revenue
For an internal communication project, it could include:
- Employee survey scores
- Email open rates
- Repetitive enquiries
- Communication delays
Without a baseline, it becomes much harder to determine whether performance actually changed.
Step 3: Track the right digital signage metrics
Do not track every available metric just because your digital signage software provides it.
Choose a small group that connects directly to your objective.
For example:
That gives you a clear measurement hierarchy.
Step 4: Connect signage data with business data
This is where your digital signage software and other business systems need to work together.
Depending on your use case, you may want to connect signage analytics with:
- POS systems
- CRM platforms
- Website analytics
- Marketing platforms
- Inventory systems
- Foot traffic data
- Customer feedback tools
The goal is to connect what happened on the screen with what happened after the exposure.
Step 5: Compare against your baseline or control group
Look at the difference between your pre-campaign and post-campaign performance.
Even better, use a control group where possible.
For example:
Then compare the change in both locations.
This helps you account for broader changes that would have affected both locations anyway.
Step 6: Calculate the financial return
Once you have your measurable gains, calculate the return.
For example:
A retailer invests $20,000 in a digital signage network.
Over the first year, it generates:
- $25,000 in attributable additional revenue
- $5,000 in printing savings
- $3,000 in labor savings
The ROI is:
This is a simplified example, but it demonstrates the principle.
Your calculation should use actual costs and realistic attribution rather than assuming every increase in sales came from the screens.
What costs should you include in digital signage ROI?
A common mistake is calculating ROI using only the cost of the screens.
The real cost of a digital signage deployment can include:
Hardware costs
- Displays
- Media players
- Mounts
- Cables
- Networking equipment
- Installation
Software costs
- Digital signage CMS
- Analytics
- Remote device management
- Integrations
- Support
Content costs
- Graphic design
- Video production
- Copywriting
- Photography
- Content management
Operational costs
- Electricity
- Internet connectivity
- Maintenance
- Repairs
- Hardware replacement
- Employee time
The more complete your cost calculation, the more credible your ROI calculation becomes.
Also readTop Digital Signage Companies in India & Worldwide 2026How digital signage content affects ROI
There is another factor that is easy to miss when discussing ROI: the screen itself is rarely the main variable.
Content matters.
A high-end display showing the same static message for three months may generate less value than a basic screen showing timely, relevant content.
Your content strategy can affect:
- Attention
- Engagement
- Conversion
- Sales
- Recall
- Customer experience
Recent research on digital signage found that its effect on purchase likelihood varied by product characteristics, timing, store conditions, message type, and proximity to the advertised product.
That means optimizing your content can be just as important as optimizing your hardware.
Test different:
- Offers
- Headlines
- Images
- Calls to action
- Product placements
- Content lengths
- Dayparting strategies
- Screen locations
Then let the data tell you what deserves more screen time.
Why screen placement matters
A brilliant message displayed in the wrong place can still fail.
If your goal is to influence a purchase, placing the screen closer to the relevant product may make the message more actionable.
For example, a screen promoting a new coffee blend is likely to be more useful near the coffee aisle than on a screen hidden near the entrance.
Think about the customer's journey:
The closer your digital signage is to the point of action, the easier it becomes to connect exposure with an outcome.
Do digital signage impressions matter?
Yes, but impressions should not be your only KPI.
Impressions tell you about potential reach. They do not necessarily tell you whether your content changed behavior.
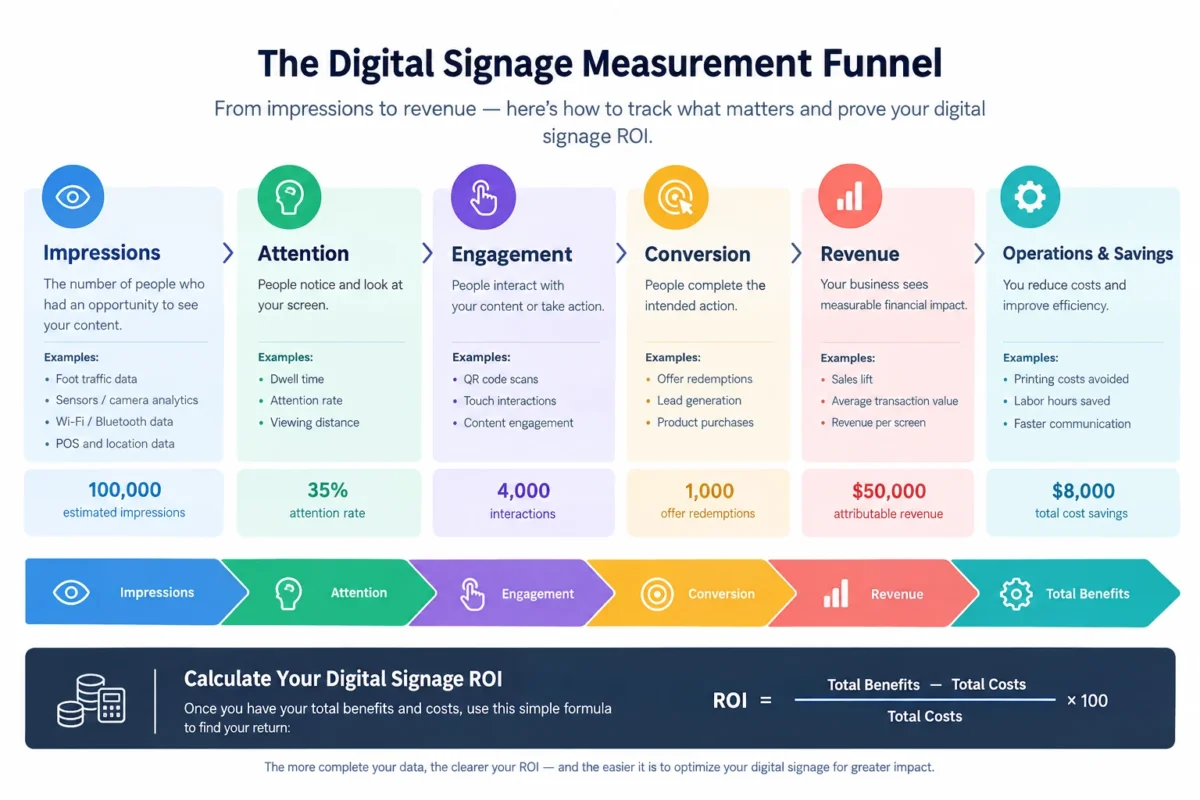
Think of impressions as the beginning of the measurement funnel:
The further down this funnel you can measure, the stronger your ROI analysis becomes.
For example, 100,000 impressions sounds impressive.
But 100,000 impressions that generate zero measurable action tell you something very different from:
The second example gives you a much clearer path to measuring business impact.
Common mistakes when measuring digital signage ROI
Measuring everything except business outcomes
It is easy to become obsessed with impressions, screen uptime, and content playback statistics.
Those numbers matter, but they do not automatically demonstrate business value.
Always connect your metrics to an objective.
Assuming correlation means causation
Sales went up after the screens were installed.
That does not necessarily mean the screens caused the increase.
Consider seasonality, pricing, promotions, traffic, advertising, weather, inventory, and other changes.
Using generic industry benchmarks as your forecast
Industry statistics can provide context, but your own baseline and test results are more relevant to your business.
A digital signage campaign in a busy hypermarket will not necessarily perform like one in a small convenience store.
Ignoring operational savings
If digital signage replaces hundreds of printed signs every month, that saving belongs in your ROI calculation.
Do not measure only revenue.
Measuring too many KPIs
More data does not automatically mean better measurement.
Choose the few metrics that directly answer the question your business is asking.
A practical digital signage ROI dashboard
If you want a simple dashboard for your digital signage network, start with these metrics:
Audience
- Impressions
- Unique viewers
- Dwell time
- Attention rate
Engagement
- Interaction rate
- QR scans
- Touch interactions
- Content engagement
Conversion
- Offer redemptions
- Leads generated
- Product conversions
- Conversion rate
Revenue
- Sales lift
- Average transaction value
- Revenue per campaign
- Revenue per screen
Operations
- Screen uptime
- Content update time
- Printing costs avoided
- Labor hours saved
Financial
- Total investment
- Total measurable benefits
- Payback period
- ROI
This gives you a much more complete picture of digital signage performance than impressions alone.
How to improve digital signage ROI
Once you start measuring performance, the next step is optimization.
Look for patterns in your data.
Which screens generate the most engagement?
Which locations generate the highest sales lift?
Which messages drive the most conversions?
Which times of day perform best?
Which products respond best to digital promotion?
Which content gets ignored?
Then adjust your digital signage strategy accordingly.
You might discover that moving a screen closer to a product produces better results. You might find that short promotional messages outperform long product explanations. Or you might discover that certain screens are better suited to informational content than sales promotions.
That is the real advantage of digital signage analytics.
You are not just measuring whether your screens work.
You are learning why they work, where they work, and how to make them work better.
Ready to make your digital signage more measurable?
The first step is having the right system behind your screens.
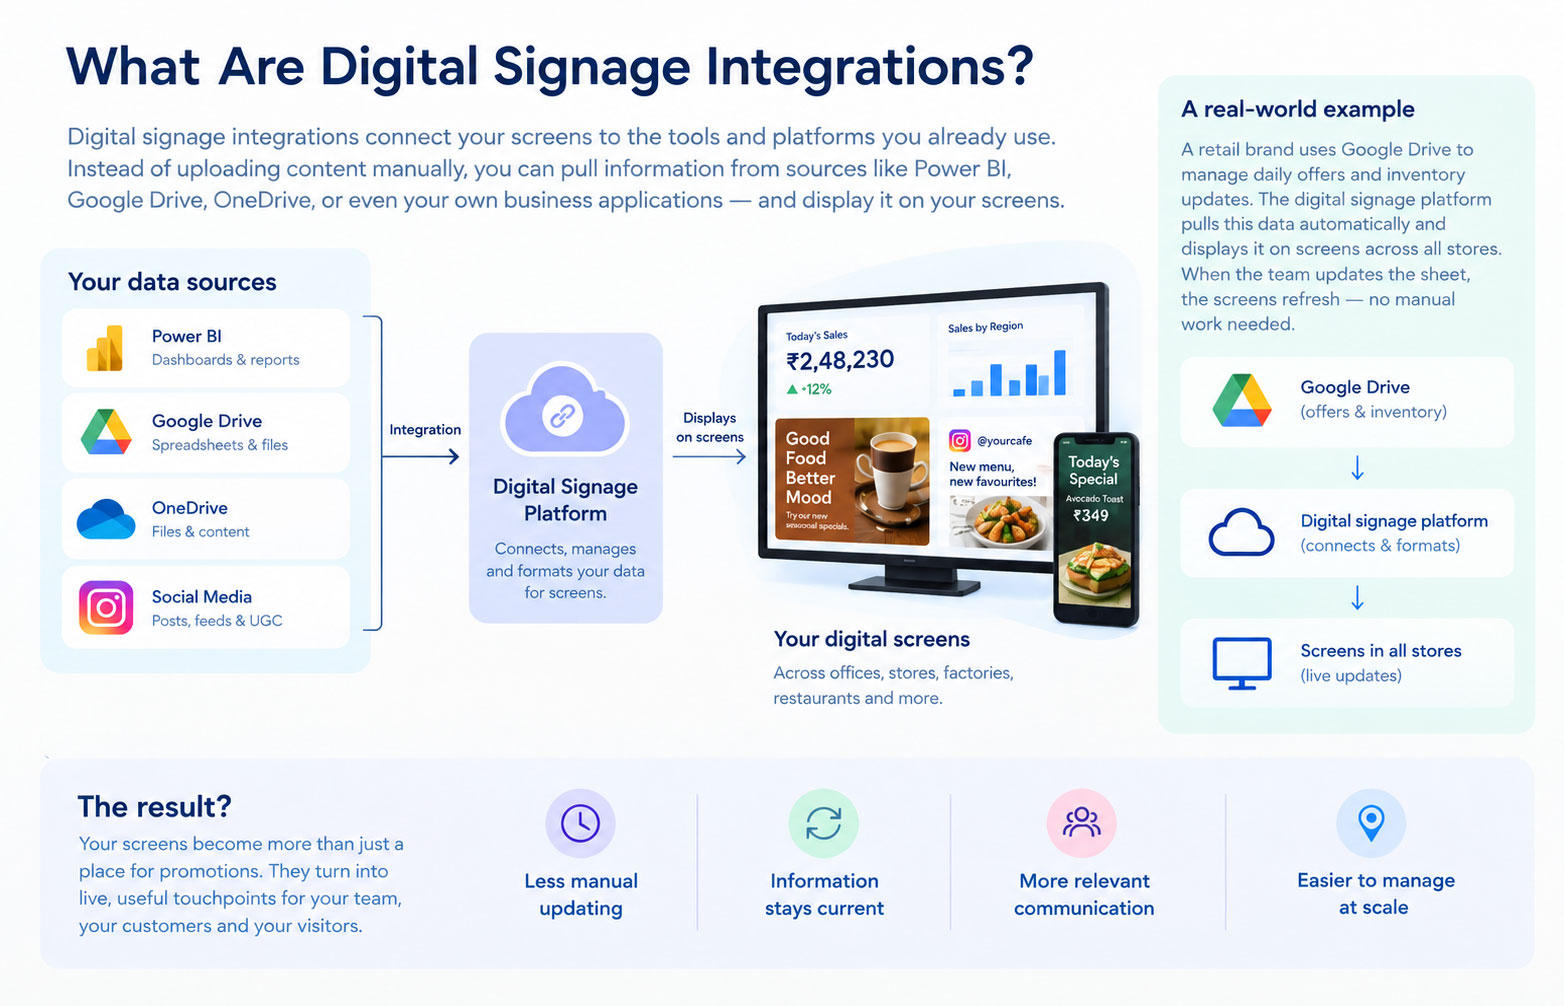
WithIntelisa, businesses can manage their digital signage network from a centralized, cloud-based platform, schedule content, monitor screens remotely, organize multiple displays, and use reporting to understand how their screens are performing. Intelisa also supports integrations that can bring business data and content from sources such as Power BI, Google Drive, OneDrive, and social media into your digital signage setup.
That means you can spend less time manually managing screens and more time figuring out what content actually drives results.
Whether you are running a handful of displays or managing a larger network across multiple locations, try Intelisa and see how much easier it can be to manage, measure, and optimize your digital signage.
Try Intelisa free →Frequently Asked Questions About Digital Signage ROI
How do you calculate digital signage ROI?
Use the formula [(Total Benefits − Total Costs) ÷ Total Costs] × 100. Benefits can include additional revenue, cost savings, and measurable operational gains. Costs should include hardware, software, installation, content, maintenance, and staff time.
What are the most important digital signage KPIs?
The most useful digital signage KPIs depend on the objective, but common metrics include impressions, dwell time, interaction rate, conversion rate, sales lift, average transaction value, QR scans, offer redemptions, customer satisfaction, printing savings, and staff time saved.
How do you measure the effectiveness of digital signage?
Start by defining a business objective and recording a baseline. Then compare performance after introducing digital signage using before-and-after analysis, A/B testing, control locations, QR codes, POS data, customer surveys, or other relevant business data.
Does digital signage increase sales?
Research suggests that digital signage can influence purchasing behavior, but the impact depends on factors such as product type, content, placement, timing, and store environment. A 2025 peer-reviewed study covering 237 campaigns and 30 million shoppers found that digital signage increased the likelihood of purchasing featured products by 8.1%.
Can digital signage ROI be measured without expensive analytics hardware?
Yes. You can start with relatively simple methods such as before-and-after sales comparisons, control locations, unique promotional codes, QR codes, offer redemptions, POS data, and printing cost comparisons. More advanced deployments can add audience measurement and computer vision analytics.
What is the difference between digital signage ROI and ROO?
ROI measures financial return relative to investment. ROO, or return on objectives, measures whether a digital signage project achieved its intended goal when that goal may not have a direct monetary value. For example, improved wayfinding, employee communication, or customer satisfaction may be better measured through ROO.
How long does it take to see digital signage ROI?
There is no universal payback period. The timeframe depends on the cost of the deployment, traffic, content strategy, sales impact, operational savings, and the business objective. The most reliable way to estimate payback is to use your own baseline data and measured performance rather than a generic industry benchmark.