Your business probably already has more data than it knows what to do with.
Sales numbers live in one dashboard. Marketing performance sits in another. Operations teams track their own KPIs. Management gets a weekly report. And somewhere, someone is probably still copying numbers into a presentation before a meeting.
But what if the people who need that information could simply look up at a screen and see it?
That is where digital signage dashboards come in.
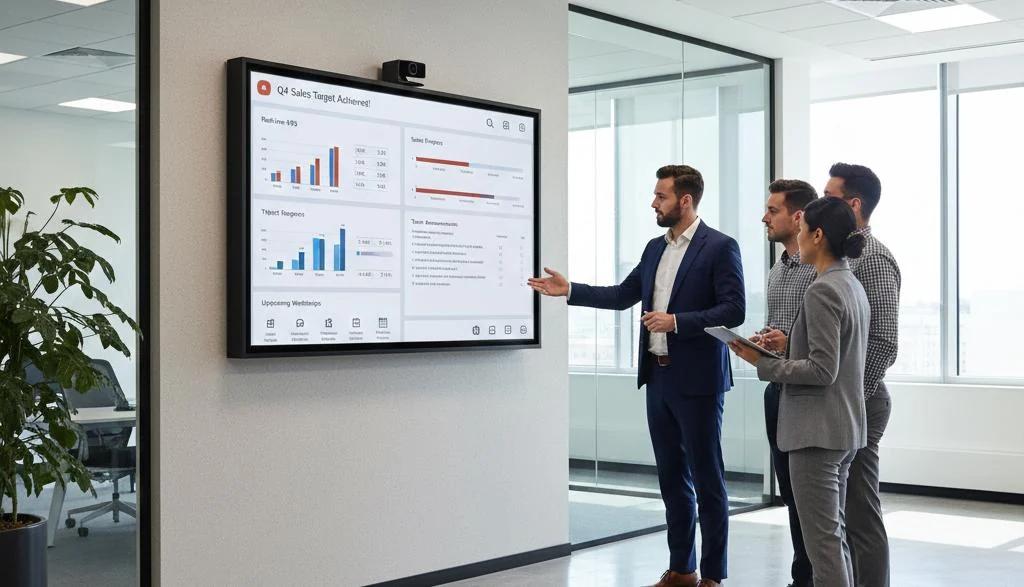
Instead of using digital signage only for promotions, announcements, or videos, businesses can use screens to display sales data, KPIs, operational metrics, performance dashboards, and other business information where teams can see it.
What Is a Digital Signage Dashboard?
A digital signage dashboard is a business dashboard displayed on a digital screen instead of being viewed only on a computer or laptop.
The dashboard can show information such as:
- Sales and revenue
- Sales targets
- Inventory levels
- Customer support metrics
- Production numbers
- Marketing performance
- Operational KPIs
- Project progress
- Other business metrics
Think about a sales manager who normally checks a Power BI dashboard every morning.
The data is useful, but it requires someone to open the dashboard, navigate to the right report, and interpret it. Now imagine that the most important numbers are already displayed on a screen in the sales area.
The team walks in, looks up, and immediately knows where things stand. That is the basic idea behind dashboard signage.
Dashboard vs. Digital Signage Dashboard
There is an important difference.
A traditional business dashboard is usually designed for someone who is actively exploring data. They might filter a report, drill into a chart, or compare different time periods.
A digital signage dashboard is designed for quick visibility. Someone may only glance at the screen for a few seconds.
That means the information needs to be:
- Easy to read from a distance
- Focused on the most important metrics
- Visually simple
- Relevant to the people viewing it
- Updated often enough to remain useful
The goal is not to put your entire analytics platform on a 55-inch screen, but to put the right information in the right place.
Why Display Business Data on Digital Signage?
The biggest advantage is simple: you don't have to make people go looking for the information.
Business data is only useful when people can access and understand it.
Microsoft describes Power BI dashboards as a way to monitor business and see important metrics at a glance. Its dashboards can also combine information from different underlying reports and data models into a consolidated view.
Putting that kind of information on a shared screen takes the same idea one step further.
Instead of waiting for someone to open a dashboard, the dashboard becomes part of the environment.
1. Make important KPIs visible
A sales team may care about:
- Revenue today
- Target
- Deals closed
- Pipeline
A customer support team may care about:
- Open tickets
- Response time
- Resolution rate
- CSAT
A production team may care about:
- Units produced
- Target
- Downtime
- Defect rate
The numbers will vary by business, but the principle stays the same.
Show people the metrics that matter to them.
2. Reduce dependence on manual reports
Imagine a regional manager responsible for 20 stores.
Instead of collecting screenshots or asking each store manager for an update, the relevant business information can be displayed centrally where teams can see it.
The less time people spend preparing information for other people to consume, the more time they can spend acting on it.
3. Give teams a shared view of performance
A dashboard on someone's laptop is private by default.
A dashboard on a screen becomes a shared reference point.
Everyone in the room can see the same target, the same progress, and the same status.
That can be particularly useful in sales floors, operations centres, warehouses, customer support teams, and corporate offices.
4. Turn screens into information hubs
A screen does not have to show one thing all day.
For example, an office display could rotate between:
- 9:00 AMSales dashboard
- 11:00 AMCompany announcement
- 1:00 PMTeam performance
- 3:00 PMCustomer or social media content
With the right digital signage software, different content can be scheduled for different times or screens.
What Business Data Can You Display on Digital Signage?
There is no single dashboard that works for every business.
The best setup depends on what your team needs to know.
Sales and Revenue Dashboards
Sales teams are one of the most obvious use cases.
A screen could display:
- Today's revenue
- Monthly revenue
- Sales target
- Target vs. actual
- Number of deals closed
- Pipeline value
- Average order value
For example, imagine a retail chain with stores across Mumbai, Delhi, Bengaluru, and Pune.
A screen in the regional office could show sales performance across locations, while individual stores could display their own daily targets.
That gives teams a quick answer to a simple question:
How are we doing right now?
Marketing Dashboards
Marketing teams have their own set of numbers.
A marketing dashboard could display:
- Website traffic
- Leads generated
- Conversion rate
- Campaign performance
- Cost per lead
- Email performance
- Social engagement
You probably would not want to put every marketing metric on the screen.
Instead, pick the handful that actually matter to the people viewing it.
Operations Dashboards
Operations teams often need information that changes throughout the day.
For example:
- Orders processed
- Production output
- Inventory
- Delivery status
- Open issues
- Machine status
- Service levels
A factory floor might need a very different dashboard from a corporate reception area.
That is why context matters as much as the data itself.
Customer Support Dashboards
A support team might benefit from a screen showing:
The point is not to make the screen look impressive.
It is to make the information immediately useful to the people working around it.
Power BI and Digital Signage Dashboards
Power BI is a natural fit for digital signage because it is already designed to turn business data into visual dashboards.
Microsoft describes a Power BI dashboard as a single-page canvas that highlights the most important parts of a data story.
That format works well for screens.
Instead of showing a spreadsheet full of rows and columns, you can display a visual summary of the metrics people actually need to see.
For example:
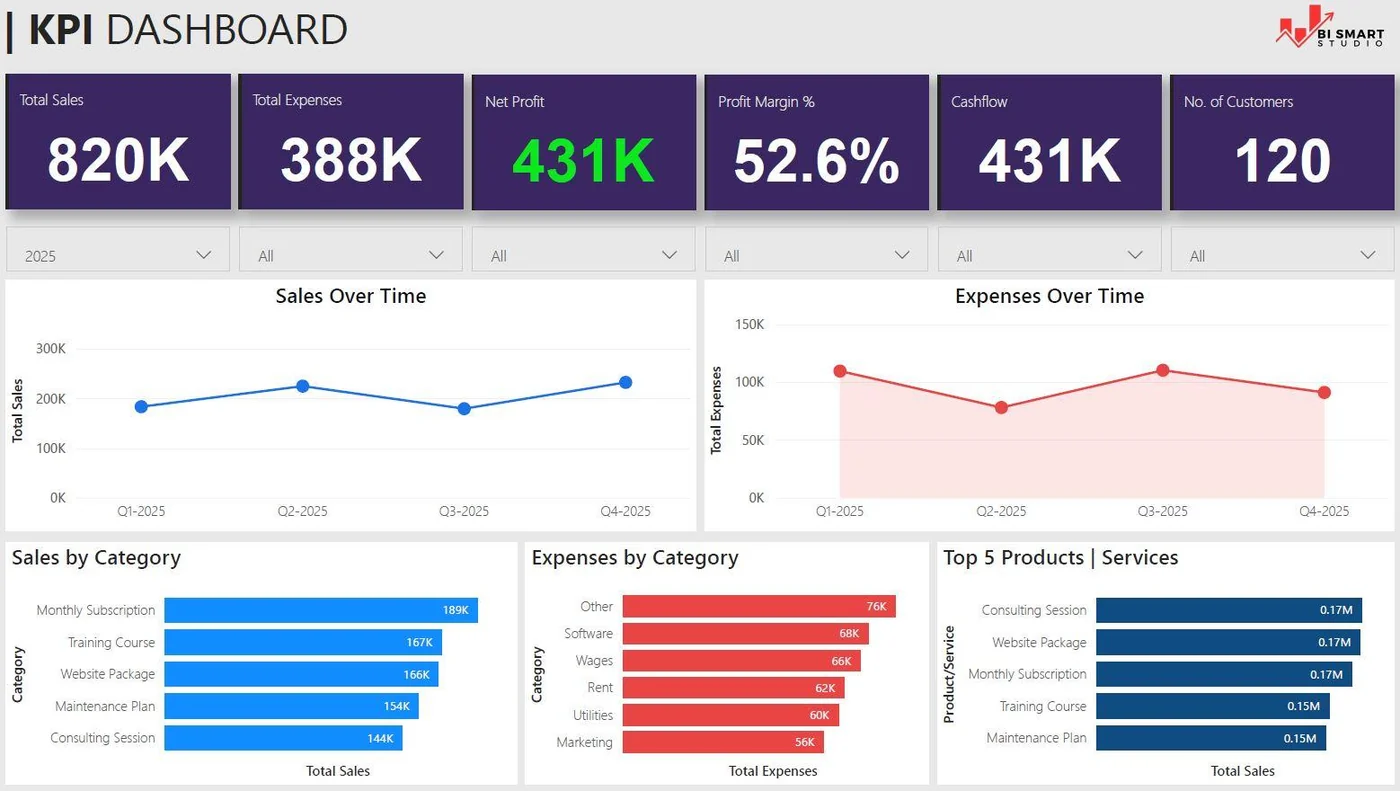
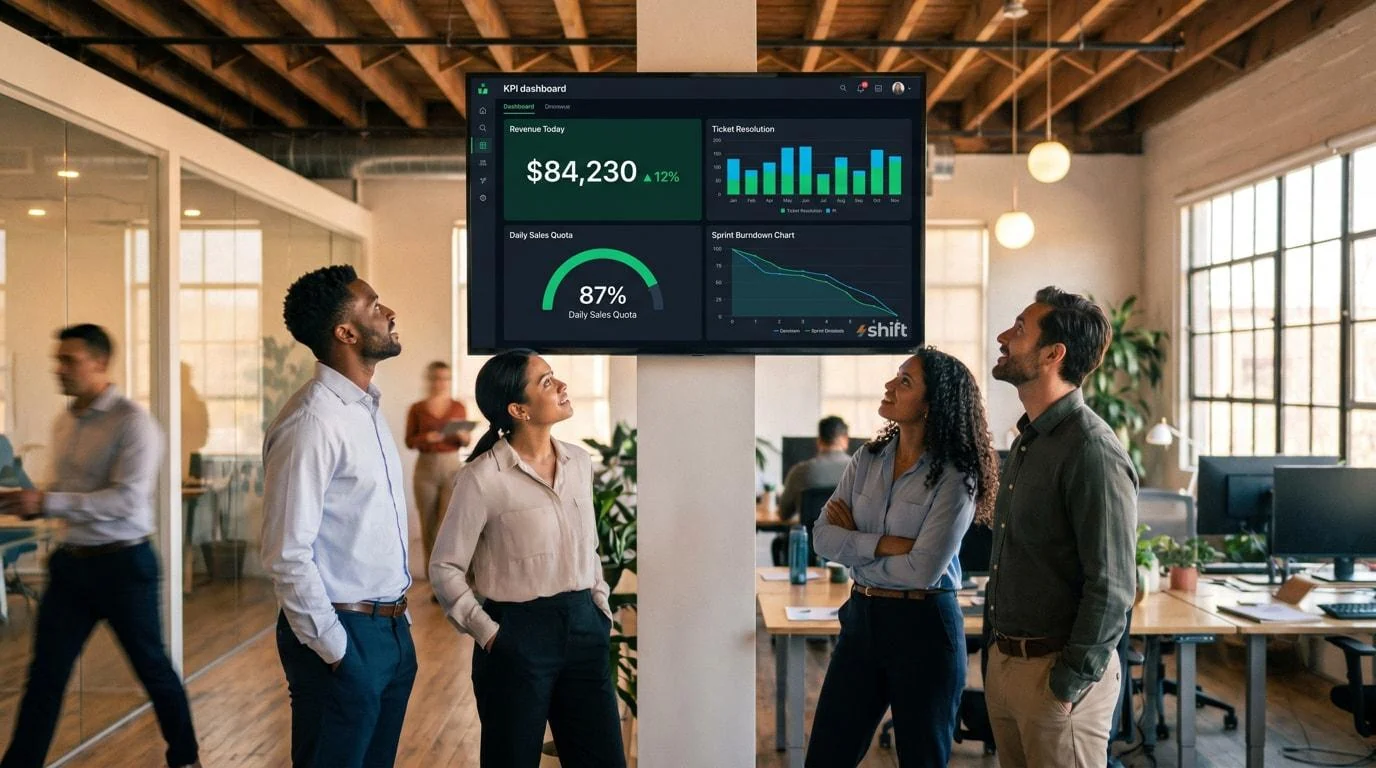
A simple sales dashboard could show:
Then use a chart to show the trend.
That is much easier to understand from across a room than a spreadsheet containing thousands of individual transactions.
Can Power BI dashboards update automatically?
Yes, depending on how the underlying Power BI data is configured.
Microsoft's documentation explains that Power BI supports different refresh approaches, including scheduled refresh and automatic page refresh. The appropriate approach depends on the storage mode, semantic model, and data source.
For real-time or near-real-time scenarios, Microsoft also documents approaches where reports can automatically refresh as data changes.
This distinction matters because the dashboard being displayed and the data feeding the dashboard are two different things.
A digital signage screen can display a dashboard, but how quickly that dashboard changes depends on the data source and refresh configuration behind it.
Real-Time vs. Scheduled Dashboard Updates
Not every dashboard needs to update every few seconds.
And that is actually a good thing.
Imagine a factory monitoring production output. A frequently updated dashboard may make sense.
Now imagine an HR team displaying monthly employee engagement metrics.
Updating that screen every minute would add very little value.
Real-time or near-real-time
Useful when the information changes frequently and people need to react quickly.
Examples:
- Production status
- Sales performance
- Orders
- Inventory
- Service queues
Microsoft notes that real-time dashboards can automatically update as new data is ingested, while also supporting configured refresh intervals where appropriate.
Scheduled refresh
Useful when the information changes less frequently.
Examples:
- Daily sales summaries
- Marketing reports
- Weekly targets
- Employee metrics
- Monthly performance
The important thing is to match the refresh approach to the information.
More frequent updates are not automatically better.
How to Design a Dashboard for a Digital Screen
Here's where many businesses get it wrong.
They take a dashboard that looks perfectly fine on a laptop and put it on a 55-inch screen.
Suddenly, the tiny labels, filters, tables, and 14 different charts are impossible to read.
A dashboard designed for digital signage needs a slightly different approach.
Keep the number of metrics under control
You do not need to show everything.
Start with the question:
What should someone understand within five seconds of looking at this screen?
If the answer is "our sales are at 87% of target," that should be the most prominent number.
Everything else should support it.
Make important numbers large
A person standing several metres away should not have to squint.
Use large KPI cards for your most important numbers and keep supporting information secondary.
Use charts for trends
Numbers tell you where you are.
Charts can show you where you are going.
For example:
Revenue: ₹24.8L
is useful.
But:
Revenue: ₹24.8L ↑ 12%
is much more informative.
A simple line or bar chart can then show how that number has changed over time.
Match the dashboard to the audience
A sales team does not need the same dashboard as a warehouse team.
For example:
| Location | Useful metrics |
|---|---|
| Sales floor | Revenue, target, deals, pipeline |
| Factory | Production, output, downtime, defects |
| Support centre | Tickets, response time, resolution rate |
| Warehouse | Orders, dispatches, inventory, errors |
| Corporate office | Revenue, growth, company KPIs |
The more relevant the dashboard is, the more likely people are to look at it.
Where Should You Display Business Dashboards?
The location of the screen matters almost as much as the data.
Corporate offices
Use dashboards in:
- Sales areas
- Meeting rooms
- Reception areas
- Common spaces
- Team floors
For example, a sales team could have a screen showing progress toward its monthly target.
Retail stores
Retail businesses can use screens to display internal sales or inventory information in staff areas while using customer-facing screens for promotions and product information.
Factories and warehouses
Operations teams can use screens to display production, order, inventory, or operational metrics.
Customer-facing environments
Some business data can also be useful for customers.
For example, a financial institution could display market information, while a logistics business could show shipment status.
The important consideration is which data is appropriate for public viewing.
Not every business metric belongs on a customer-facing screen.
What About Data Security?
This is one area you should think about before putting a dashboard on a screen.
A dashboard may contain information that is perfectly appropriate for an internal team but should never be visible to customers or visitors.
Before displaying business data, consider:
- Who can see the screen?
- Does the dashboard contain confidential information?
- Are individual employee metrics visible?
- Does the data include customer information?
- Is the screen located in a public area?
- Who has permission to change the content?
The safest approach is to create screen-specific dashboards rather than simply putting an existing executive dashboard on every display.
For example, your sales team may see pipeline information, while a reception screen might only show company-wide revenue growth.
How Do Digital Signage Dashboards Work?
The setup is relatively straightforward.
Step 1: Choose the data you want to display
Start with the business question, not the screen.
What should people know?
What should they monitor?
What should they act on?
Step 2: Build or select the dashboard
Use the BI or business analytics platform your team already works with.
Power BI is one example.
Step 3: Connect the dashboard to your digital signage setup
The exact process depends on the digital signage platform and the dashboard you're using.
The goal is to make the dashboard available as part of your screen content.
Step 4: Choose the right screen
Consider where the screen will be placed, how far away viewers will be, and whether the information is intended for employees, customers, or both.
Step 5: Schedule and manage the display
A dashboard doesn't necessarily need to occupy the screen all day.
You might show:
depending on the audience and location.
Step 6: Monitor the screen
Once the system is running, make sure the screen is online and the information is refreshing as expected.
This is particularly important for dashboards because stale data can be more misleading than no data at all.
Common Mistakes to Avoid
Showing too much information
A screen is not a dumping ground for every KPI your business tracks.
Choose the metrics that matter most.
Using tiny text
If people have to stand directly in front of the screen to read it, the dashboard is not doing its job.
Displaying irrelevant KPIs
A warehouse team doesn't need to see your marketing team's campaign metrics.
Make each screen relevant to its audience.
Forgetting about refresh rates
A dashboard displaying yesterday's numbers without making that clear can create confusion.
Always understand how frequently the underlying data refreshes.
Putting confidential information on public screens
Check the visibility and permissions of your dashboard before displaying it in reception areas, stores, or other public spaces.
Treating the screen like a laptop
Digital signage is designed for glanceable information.
Design for someone who looks at the screen for a few seconds, not someone who sits in front of it for 30 minutes.
How Intelisa Can Help Display Business Dashboards
Once you have the right dashboard, you still need a simple way to get it onto the right screens.
That's where a digital signage platform comes in.
Intelisa's digital signage software is designed to let businesses centrally manage their digital screens, including scheduling, remote monitoring, screen grouping, and dashboards. Intelisa also supports custom widgets for dynamic business dashboards.
For businesses managing multiple screens, that central control becomes particularly useful.
You could have:
All managed through a centralized digital signage setup.
Intelisa's current product information also lists live dashboarding for views, custom widgets, scheduling, screen grouping, and remote screen previews among its capabilities.
The important part is that the dashboard doesn't have to replace your existing business intelligence tools.
Your BI platform remains the place where the data is analyzed.
Your digital signage platform becomes the last mile that puts the right information where people can see it.
Ready to put your business data on screen? Explore Intelisa's digital signage platform and see how you can manage dashboards and content across your screens.
Explore IntelisaFAQs
1. What is a digital signage dashboard?
A digital signage dashboard is a business dashboard displayed on a digital screen instead of being viewed only on a computer or phone. It can show key metrics such as sales, revenue, marketing performance, operations, or customer support data, making important information visible to teams at a glance.
2. What business data can be displayed on digital signage?
You can display many types of business data, including sales and revenue, marketing performance, operational metrics, inventory, customer support data, and business KPIs. The right metrics depend on who is viewing the screen and what decisions or information they need to see.
For example, a sales team might see revenue against target, while an operations team might see production numbers, inventory levels, or order status.
3. Can you display Power BI dashboards on digital signage?
Yes. Power BI dashboards can be used as a source for digital signage displays. Power BI dashboards bring together visualizations and important metrics on a single canvas, making them suitable for at-a-glance monitoring.
The dashboard still needs to be configured appropriately for the screen, including its layout, refresh behavior, and visibility.
4. Can digital signage dashboards update in real time?
They can update automatically, but "real time" depends on the data source, dashboard platform, and refresh configuration. For example, Power BI supports automatic page refresh for supported data sources, while Microsoft Fabric Real-Time Dashboards support live refresh when new data is ingested.
It's also worth noting that real-time data usually means near real-time, because there can be some processing and network latency between the source and the screen.
5. What KPIs should you display on a business dashboard?
The KPIs you display should depend on the team, location, and purpose of the screen. Common examples include:
- Sales: revenue, orders, conversion rate, target achievement
- Marketing: leads, conversions, campaign performance
- Operations: production, inventory, order status, turnaround time
- Customer support: open tickets, response time, resolution rate
- Management: revenue, growth, profitability, and other high-level business metrics
For a digital signage screen, focus on the metrics that people need to understand without having to study the dashboard for several minutes.
6. How do digital signage dashboards work?
A typical setup works like this:
First, your business data is connected to or represented in a dashboard. The dashboard is then displayed through digital signage software, which controls where and when it appears. The software can also handle scheduling, screen grouping, monitoring, and other display management tasks.
7. Where can businesses use digital signage dashboards?
Digital signage dashboards can be used anywhere teams or customers need access to frequently updated business information. Common examples include:
- Corporate offices: sales and company performance
- Retail stores: sales, inventory, and store performance
- Factories and warehouses: production and operational metrics
- Customer-facing spaces: selected business or service information
- Multiple locations: centrally managed dashboards across different offices or stores
The dashboard should be tailored to the people who will actually see it.
8. Are digital signage dashboards secure?
Digital signage dashboard security depends on the dashboard platform, digital signage software, network configuration, and access controls being used.
Businesses should consider who can access the dashboard, what data is displayed publicly, how users are authenticated, and how screens are managed remotely. Sensitive financial, customer, or employee information should only be displayed where the appropriate access and privacy controls are in place.
9. How much does digital signage dashboard software cost?
The total cost depends on the digital signage software, number of screens, hardware, features, and deployment requirements.
For example, Intelisa currently lists its Lite plan at ₹550 per screen/month and its Pro plan at ₹800 per screen/month, with enterprise pricing available separately. Both listed plans include live dashboarding.
The software subscription is only one part of the total cost. Businesses also need to account for the display and, depending on the setup, a media player and installation.